Correlation of apparent diffusion coefficient value on diffusion-weighted imaging and SUV values on PSMA PETCT in patients with biopsy-proven prostate cancer
Authors: S. S. Shivalingappa, K. Kallur, I. Desai, M. A. Kumar, G. R. Prashanth, S. Neelakantan, S. Sampangi, A. Kesari, P. S. Sridhar; Bangalore/IN
Categories: Molecular imaging, Oncology, Hybrid Imaging, PET-MR, PET-CT, MR-Diffusion/Perfusion, Cancer


Purpose
Prostate cancer is the most common cancer in men in developed countries. Treatment strategies in prostate cancer is mainly influenced by the presence or absence of metastasis. Many imaging studies have been described and implemented which include computed tomography (CT) and magnetic resonance imaging (MRI), or functional imaging with F-18-FDG PET/CT and F-18-Choline PET/CT. The sensitivity of these tests are relatively low with respects to the primary as well as in assessing the metastatic disease.
>> Read more (extend)
Glutamate carboxypeptidase II, also known as prostate specific membrane antigen (PSMA) is a zinc dependent peptidase, highly expressed by all prostate cancers and its expression increases with tumor aggressiveness, metastatic disease and disease recurrence (1-3). The unique expression profile of PSMA provides an excellent target for prostate cancer imaging and therapy (4-5).
Magnetic resonance imaging (MRI) of prostate cancer with conventional T2-weighted imaging is the modality of choice for local staging of prostate cancer in imaging. The presence of extra capsular extension, neurovascular infiltration, seminal vesicle involvement, urinary and rectal wall infiltration are best assessed with T2W MR imaging. The application of functional MRI, which include diffusion-weighted imaging (DWI) and dynamic contrast enhanced (DCE) MRI, has added to the diagnostic accuracy of MRI by noninvasive characterization of prostate cancer and providing more accurate information regarding tumor location, size, spread, and aggressiveness (6-7).
Several studies have shown that DWI can differentiate between benign and malignant prostatic tissue on the basis of low apparent diffusion coefficient (ADC) values of prostate carcinoma in comparison with normal prostate tissue. The reported ADC values of prostate cancer in the peripheral zone range between 0.98 and 1.45 × 10⁻³ mm2/s (6, 8-13).
We correlate apparent diffusion coefficient (ADC) values on diffusion-weighted imaging and SUV values on PSMA PETCT in patients with biopsy proven prostate cancer.
Methods and materials
This is a prospective study conducted in our hospital, Department of Molecular Imaging, over the last 6 months. 22 patients with biopsy-proven prostate cancer were included. All these patients underwent PSMA PET/CT imaging (Siemens Biograph 128 Slice PET/CT scanner) as a staging investigation and were subjected to prostatic pelvic MRI (3T SKYRA 48 channels).
>> Read more (extend)
Ga68 –PSMA Imaging protocol: With the patient fasting for 3 hours, 3.5 mci of Ga68 PSMA was injected intravenously and 3D PET/CT scan was performed one hour later. Iodinated contrast for diagnostic CT was considered only in patients with normal renal functions. Physiological concentration will be seen in the lacrimal glands, salivary glands, kidneys, liver, spleen and bladder.
PETCT Image analysis: PSMA PET/CT images were analyzed on GE work station (AW 4.6). Mean and maximum SUV values were obtained.
MRI prostate protocol: MRI imaging of the prostate was performed without gadolinium with 3.0 T machine (SKYRA, Siemens) using pelvic phased array coil. MRI pelvis protocol included sagittal, axial and coronal turbo spin echo T2-weighted images, axial turbo spin echo T1-weighted images and diffusion weighted axial images (b-value 50, 400, and 1000 s/mm2) with ADC maps (see figures 1 a & b; figure 2 & figure 3 a, b & c).
MRI images analysis: Images were analyzed on MMWP work station and ROIs were drawn for the ADC values at the corresponding regions of elevated SUV values.
After the analysis of PET/CT and MRI, PET-MRI fusion was performed with PET and the axial T2W images respectively using ADW 4.6 PETMRI fusion software. Automatic and manual registration techniques were used for anatomical fusion (figures 1 c & d; figures 3 d, e & f).
Data Analysis: ADC values were compared with SUV values using one-way Pearson Bivariate relationships were determined between SUV and ADC. T2W MR images were also correlated with ADC values and PET-MRI fusion with T2 W axial images was performed to assess the extent of the lesion.
Fig 1: High resolution T2W axial images of the prostate at the level of base (a) and mid gland (b) shows large T2 hypointense lesions (arrows). The corresponding PSMA PET-MRI fusion images (c & d) correlates and confirms with location of the lesions.
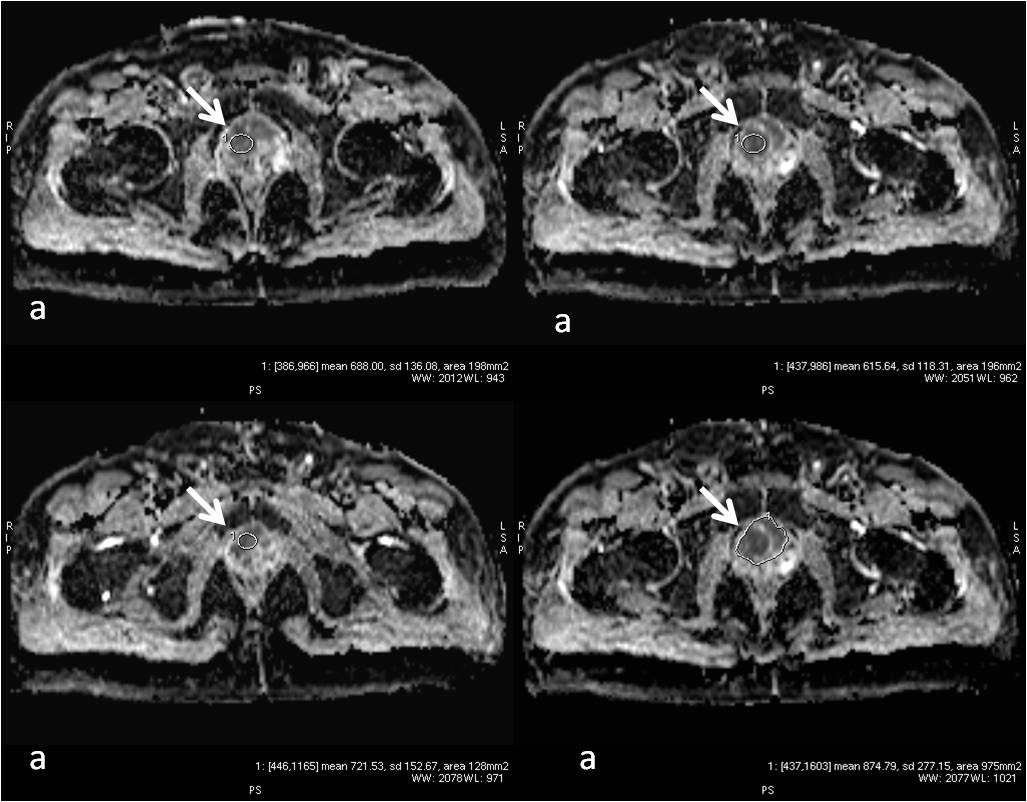
Fig 2: Axial MRI ADC map images (a, b, c & d). The areas of high SUV on PET and T2 hypointensity in fig 1 show low ADC values (arrows). The ADC values ranged between 0.386 x 10⁻³ mm2/s to 1.16 x 10⁻³mm2/s.
Fig 3: High resolution T2W axial images of the prostate (a, b & c) shows large exophytic T2 hypointense mass lesions (arrows) extending to the left pelvic wall and infiltrating the mesorectum. The corresponding PSMA PET-MRI fusion images (d, e & f) correlates and confirms with location of the lesions. Also the metastatic pelvic lymph nodes show uptake on PET (curved arrows).
Fig 4: Axial MRI ADC map images (a, b, c & d). Significant diffusion restriction is seen on corresponding DWI images (a & c). The areas of high SUV on PET and T2 hypointensity in fig 1 show low ADC values (arrows). The ADC values ranged between 0.392 x 10⁻³ mm2/s to 1.27 x 10⁻³mm2/s.
Results
T2W hypointensity and low ADC on MRI correlated with high SUV uptake areas on PSMA PET images. There was a significant negative correlation between SUV max with Mean ADC (r =-525, p=0.01). There was a significant negative correlation of Max SUV with min ADC (r= -0.602, p=0.005) (figure 5). The ADC values were significantly low and mean SUV values were high with Gleason’s score of >8.
Fig 5 (a & b): Bivariate Relationship between max SUV and ADC shows negative correlation.
Conclusion
Quantitative ADC values in correlation with PSMA PET/CT help in localization, assessing the extent of the disease and also probably determines the aggressiveness of the disease. The combination of limited MRI of the prostate without Gadolinium combined with PSMA-PET/CT can be the imaging investigation of choice in a case of prostate cancer for local staging and metastatic workup, thereby limiting additional investigations.
References
>> Read more (extend)
1.Wright GL Jr, Haley C, Beckett ML et al. Expression of prostate-specific membrane antigen in normal, benign, and malignant prostate tissues. Urol. Oncol. 1, 18-28 (1995).
2. Perner S, Hofer MD, Kim R et al. Prostatespecific membrane antigen expression as a predictor of prostate cancer progression. Hum. Pathol. 38, 696-701 (2007).
3. Wright GL Jr, Grob BM, Haley C et al. Upregulation of prostate-specific membrane antigen after androgen-deprivation therapy. Urology. 48, 326-334 (1996).
4. Eder M, Schäfer M, Bauder-Wüst U et al. 68Ga-complex lipophilicity and the targeting property of a urea-based PSMA inhibitor for PET imaging. Bioconjug. Chem. 23, 688-697 (2012).
5. Eder M, Schafer M, Bauder-Würst U et al. Preclinical evaluation of a bispecific lowmolecular heterodimer targetting both PSMA and GRPR for improved imaging and therapy of prostate.
6. C. K. Kim, B. K. Park, J. J. Han, T. W. Kang, and H. M. Lee, “Diffusion-weighted imaging of the prostate at 3 T for differentiation of malignant and benign tissue in transition and peripheral zones: preliminary results,” Journal of Computer Assisted Tomography, vol. 31, no. 3, pp. 449–454, 2007. View at Publisher·View at Google Scholar · View at Scopus
7. Y. J. Choi, J. K. Kim, N. Kim, K. W. Kim, E. K. Choi, and K. S. Cho, “Functional MR imaging of prostate cancer,” Radiographics, vol. 27, no. 1, pp. 63–75, 2007. View at Publisher· View at Google Scholar · View at Scopus
8. M. D. Pickles, P. Gibbs, M. Sreenivas, and L. W. Turnbull, “Diffusion-weighted imaging of normal and malignant prostate tissue at 3.0 T,” Journal of Magnetic Resonance Imaging, vol. 23, no. 2, pp. 130–134, 2006. View at Publisher· View at Google Scholar · View at Scopus
9. P. Gibbs, M. D. Pickles, and L. W. Turnbull, “Diffusion imaging of the prostate at 3.0 tesla,” Investigative Radiology, vol. 41, no. 2, pp. 185–188, 2006. View at Publisher· View at Google Scholar · View at Scopus
10. B. Zelhof, M. Pickles, G. Liney et al., “Correlation of diffusion-weighted magnetic resonance data with cellularity in prostate cancer,” BJU International, vol. 103, no. 7, pp. 883–888, 2009. View at Publisher·View at Google Scholar · View at Scopus
11. T. Tamada, T. Sone, Y. Jo et al., “Apparent diffusion coefficient values in peripheral and transition zones of the prostate: comparison between normal and malignant prostatic tissues and correlation with histologic grade,” Journal of Magnetic Resonance Imaging, vol. 28, no. 3, pp. 720–726, 2008. View at Publisher· View at Google Scholar · View at Scopus
12. V. Kumar, N. R. Jagannathan, R. Kumar et al., “Apparent diffusion coefficient of the prostate in men prior to biopsy: determination of a cut-off value to predict malignancy of the peripheral zone,” NMR in Biomedicine, vol. 20, no. 5, pp. 505–511, 2007. View at Publisher· View at Google Scholar · View at Scopus
13. B. Issa, “In vivo measurement of the apparent diffusion coefficient in normal and malignant prostatic tissues using echo-planar imaging,” Journal of Magnetic Resonance Imaging, vol. 16, no. 2, pp. 196–200, 2002. View at Publisher · View at Google Scholar · View at Scopus
Contact
Dr. Dr. Shivakumar Shivalingappa
HCG Oncology Enterprises
P. Kalingarao Road, S. R. Nagar,
560027 Bangalore
Karnataka, INDIA
Email